
Hubbard Radio Washington DC, LLC. All rights reserved. This website is not intended for users located within the European Economic Area.
When it comes to the federal Thrift Savings Plan, financial planner Arthur Stein says the average doesn't tell you everything because TSP stock funds do not hav...
If your assignment was to wade across the Mississippi River at its widest point how helpful would it be to know its average depth? The short answer is probably not very.
When it comes to the federal Thrift Savings Plan, financial planner Arthur Stein says the issue is “What averaged doesn’t tell you.” TSP stock funds do not have many “average” years.
“The typical ways to view TSP returns is to look at the total return over a certain time period — annually, quarterly, year to date — or the average annual return over a number of years,” he said.
| TSP Percentage Returns (Dec. 31, 2017) | ||||||
| Type | Date | G Fund — Bonds | F Fund — Bonds | C Fund — Stocks | S Fund — Stocks | I Fund — International Stocks |
| Total Return | 2017 | 2.3% | 3.8% | 21.8% | 18.2% | 25.4% |
| Average Annual Returns | 5-Year | 2.1% | 2.5% | 15.9% | 14.8% | 8.1% |
| 10-Year | 2.4% | 4.3% | 8.6% | 9.4% | 2.2% | |
| Past performance is no guarantee of future performance. Source: TSP.gov | ||||||
“That is a logical way to view the data but it makes it hard to discern patterns,” Stein said. “A good alternative is to rank the returns by size.” Here are 25 years of TSP returns and their sizes:
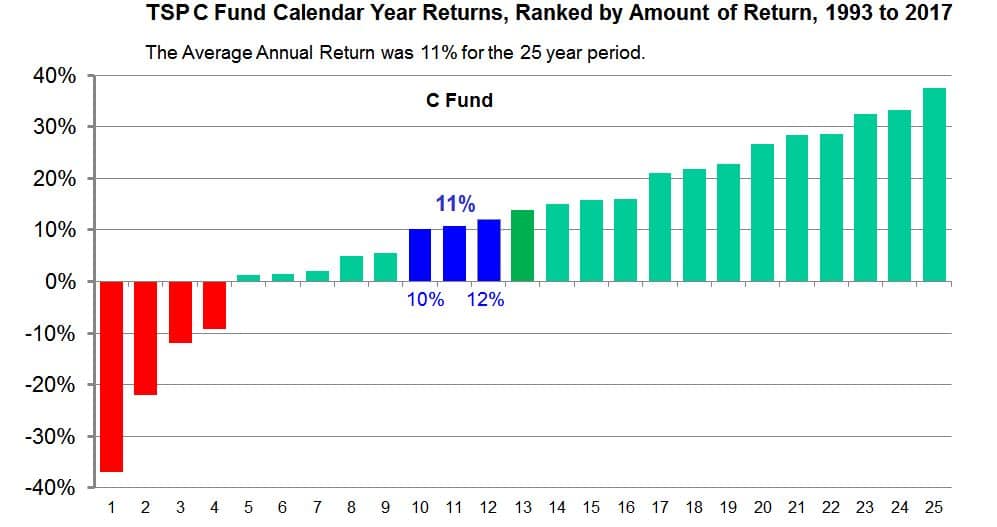
Stein said patterns are easier to spot when returns are ranked by size. For instance, over the last 25 calendar years:
| TSP C Fund Calendar Year Returns, Ranked by Amount of Return, 1993 to 2017 | |||||||||
| # | 1 | 2 | 3 | 4 | 5 | 6 | 7 | 8 | |
| Year | 2008 | 2002 | 2001 | 2000 | 1994 | 2015 | 2011 | 2005 | |
| C Fund Returns | -37% | -22% | -12% | -9% | 1% | 1% | 2% | 5% | |
| # | 9 | 10 | 11 | 12 | 13 | 14 | 15 | 16 | 17 |
| Year | 2007 | 1993 | 2004 | 2016 | 2014 | 2010 | 2006 | 2012 | 1999 |
| C Fund Returns | 6% | 10% | 11% | 12% | 14% | 15% | 16% | 16% | 21% |
| # | 18 | 19 | 20 | 21 | 22 | 23 | 24 | 25 | |
| Year | 2017 | 1996 | 2009 | 1998 | 2003 | 2013 | 1997 | 1995 | |
| C Fund Returns | 22% | 23% | 27% | 28% | 29% | 32% | 33% | 37% | |
What does it mean for investors?
“Historically, the C Fund compensated investors for the additional risk of stocks,” Stein said. “Past performance is no guarantee of future performance. We don’t know what will happen in the future. But past patterns seem clearer.”
That is excellent advice, especially since many experts say the stock market is long overdue for a major correction of 20 percent or more. Art Stein will be my guest on today’s Your Turn radio show at 10 a.m. EDT at www.federalnewsradio.com or 1500 AM in the D.C. area. Send any questions for Stein to me at mcausey@federalnewsradio.com.
By Amelia Brust
Rubies and sapphires are actually two varieties of the same mineral: corundum.
Source: Minerals.net
Copyright © 2024 Federal News Network. All rights reserved. This website is not intended for users located within the European Economic Area.

Mike Causey is senior correspondent for Federal News Network and writes his daily Federal Report column on federal employees’ pay, benefits and retirement.
Follow @mcauseyWFED